Get the latest tech news
Phantom Menance: memory leak that wasn't there
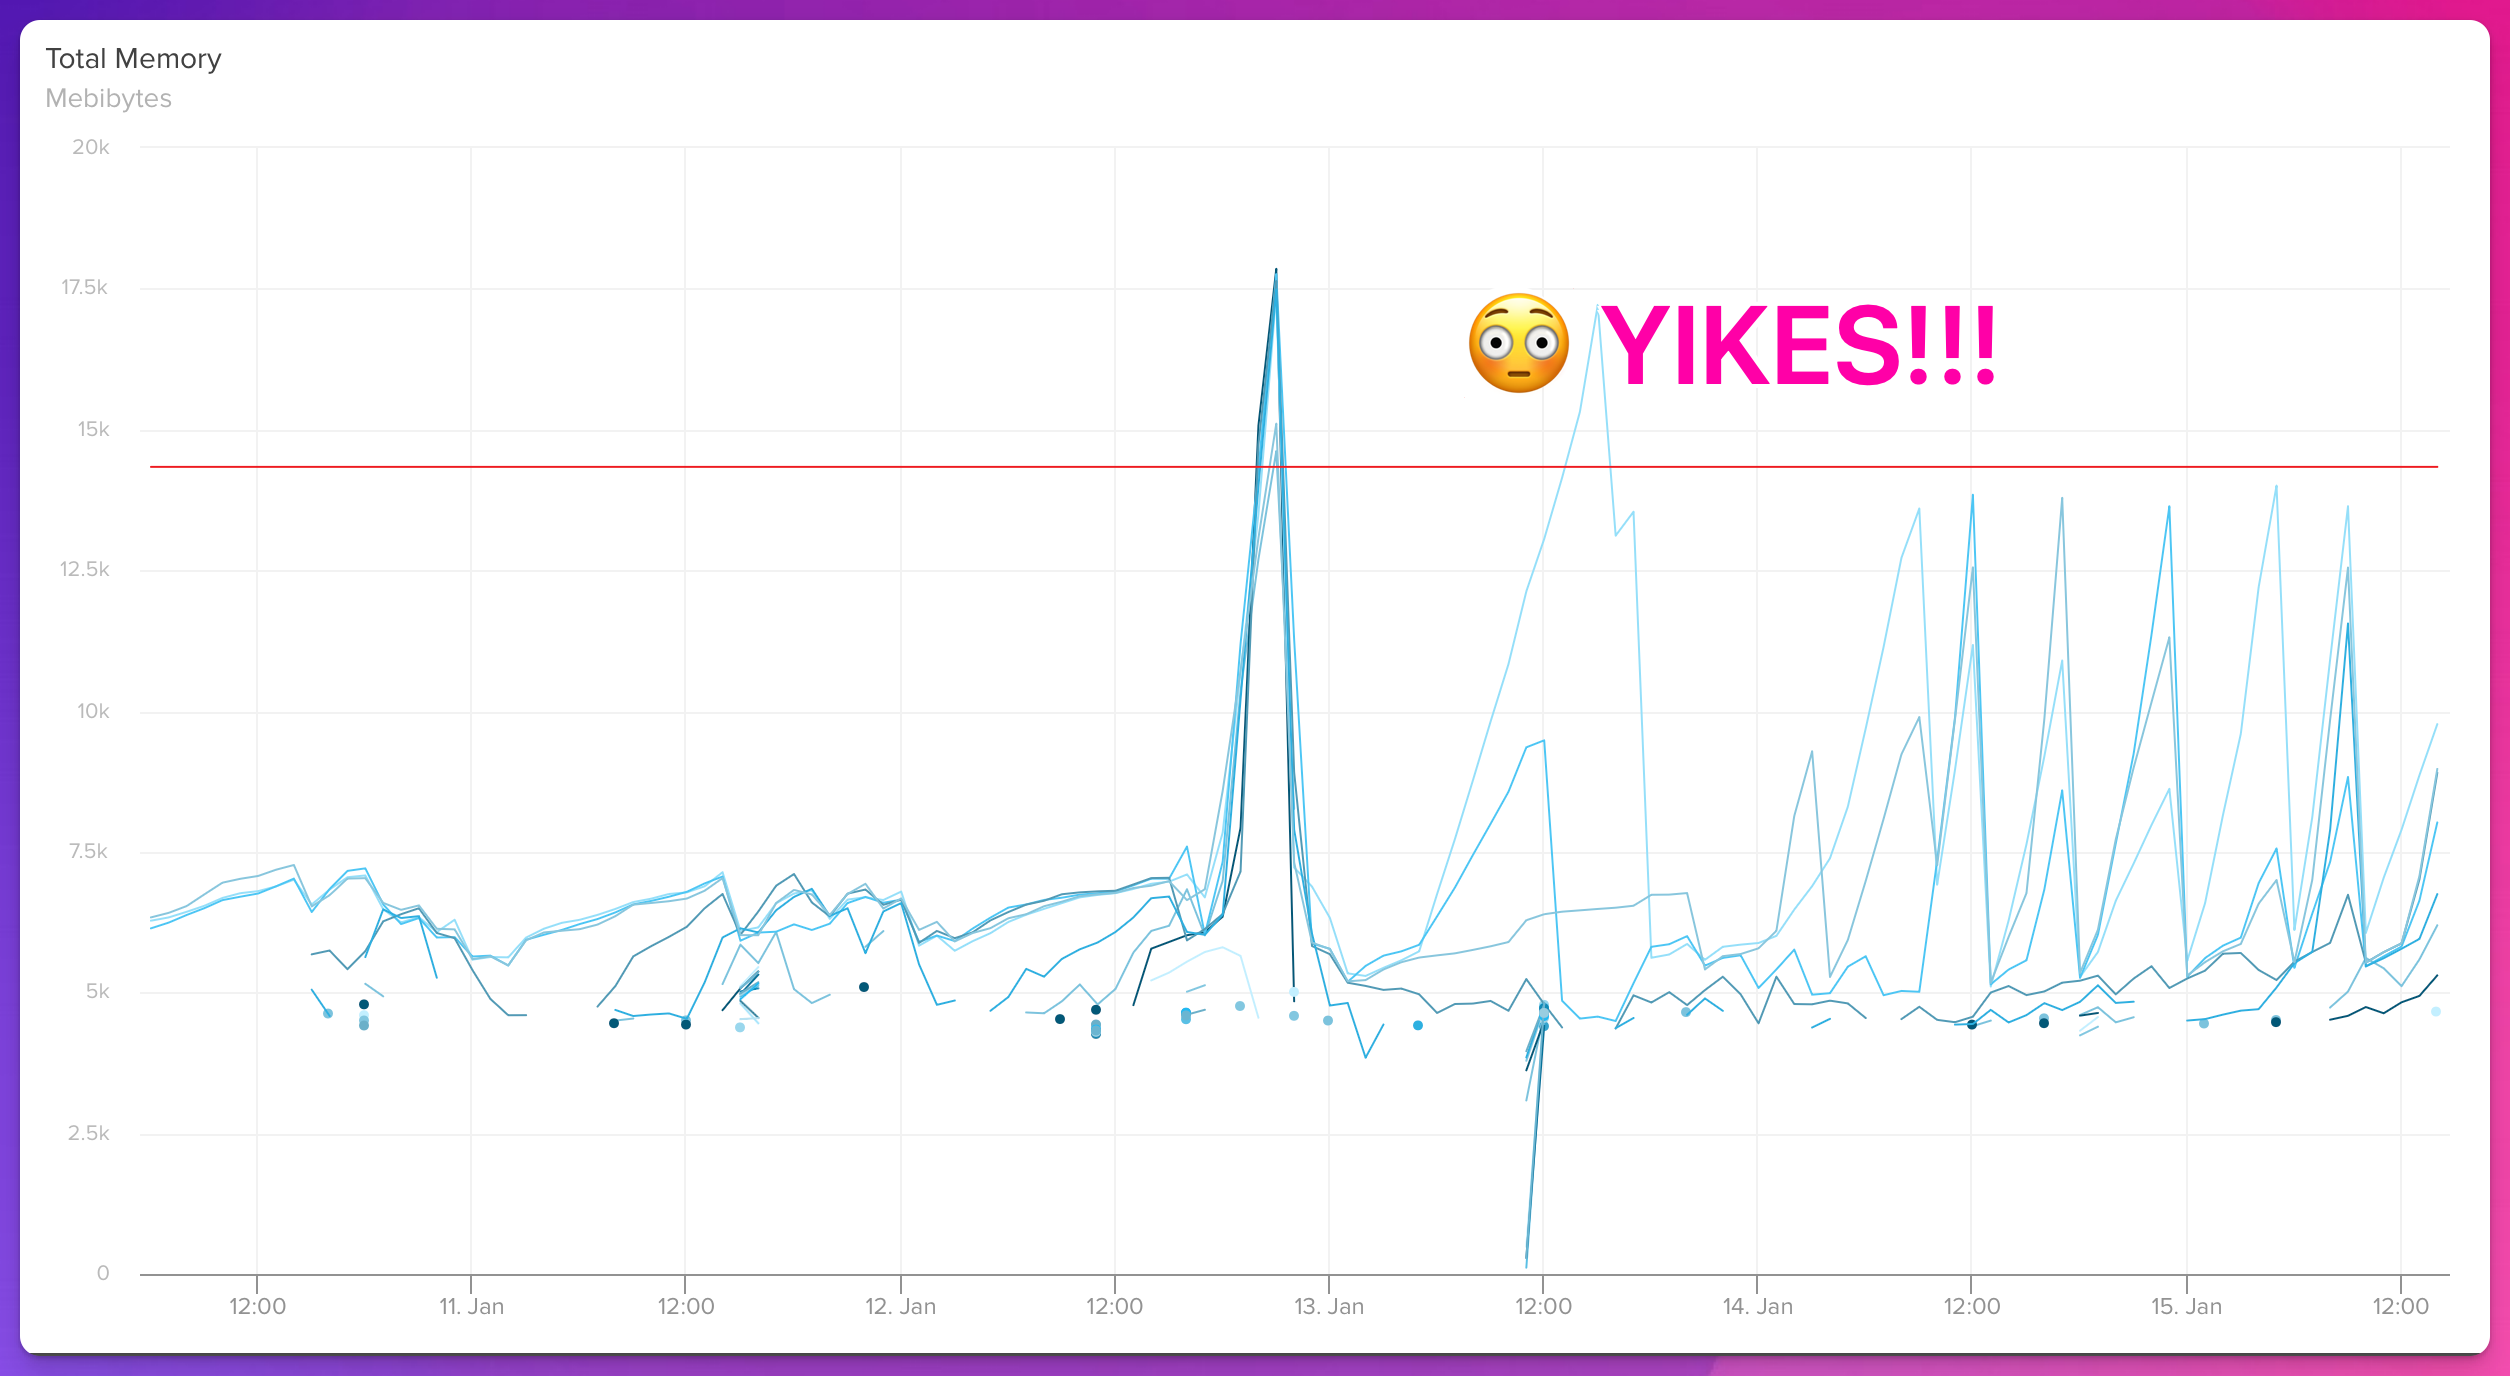
I share the story of a frustrating debugging journey with a Rust application that was migrated to Kubernetes. Everything seemed fine until a suspected memory leak caused our application to scale uncontrollably. I dove deep into tracing memory usage with eBPF, heaptrack, and jemalloc profiling tools. The real twist came when I discovered that the memory leak was a phantom menace - a misinterpretation of Kubernetes memory metrics rather than a genuine issue. This post details the steps I took, the tools I used, and the lessons I learned about problem-solving, metric accuracy, and effective debugging in containerized environments.
To make things worse, the application was using jemalloc, but imagemagick started using system allocator a long time ago. Inspired by greptime’s blog entry we had to add an additional endpoint to the application that would enable us to create a heap profile and check for leaks or excessive memory usage. However, after getting a better grasp of the matters, we decided to add additional alerts for residents with a set size of the application to catch potential bugs in the future.
Or read this on Hacker News